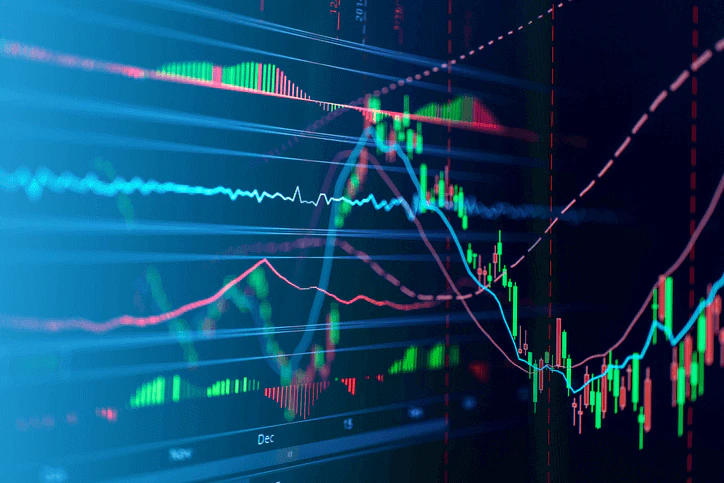
Understanding candlesticks in trading

If you are a trader or aspiring trader looking to understand the intricacies of candlestick charting, you have come to the right place. Candlestick charts have long been a staple in technical analysis, providing valuable insights into market trends and price patterns across markets, from stocks and forex to commodities. However, deciphering these candlestick formations can often be daunting for beginners.
In this comprehensive guide, we will delve into the world of candlesticks, exploring their history, structure, and patterns they can form. By the end of this guide, you will have a solid foundation in understanding candlestick charts, equipping you with the knowledge to make more informed trading decisions.
Introduction to candlesticks and their importance in trading
Candlestick charts are a popular tool in options trading. Seasoned traders highly regard them for their ability to provide a wealth of information about the markets at a glance. These charts originated in Japan in the 18th century when rice traders developed a visual representation of price movements. Today, they are widely used and accepted by traders worldwide, offering a unique method of analysing market trends and patterns.
By indicating the opening and closing prices and the highs and lows of each trading session, candlesticks are a valuable resource for traders in determining price movements and the likelihood of future market activity. In short, understanding candlesticks is crucial for any trader looking to make informed trading decisions.
History of candlestick charting and its origins in Japanese rice markets
Candlestick charting has a long and rich history, with its roots in 18th-century Japan. It is believed that the Japanese rice trader Munehisa Homma developed candlestick charts to track the price movements of rice to make more informed trading decisions. Other traders later refined this technique, which became widely used in various financial markets.
Initially, candlestick charts were used solely for the Japanese rice market. However, with the growth of global trading in the 19th century, they also found their way into other markets. Today, candlestick charting is an integral part of technical analysis and is used by traders across different asset classes, including stocks, forex, commodities, etc.
Explanation of basic candlestick patterns
Candlestick charts consist of individual candlesticks that represent a specific period, ranging from one minute to a month or even longer. The main components of a candlestick are its body and wicks, also known as shadows. The body represents the difference between the opening and closing prices, while the wicks show the highs and lows of each trading session.
Traders should be familiar with several basic candlestick patterns, including the doji, hammer, and shooting star. These patterns can provide valuable insights into market sentiment and potential price movements. Traders must understand these patterns and their implications to make well-informed trading decisions.
Advanced candlestick patterns and how to interpret them
In addition to the fundamental candlestick patterns, traders can utilise numerous advanced patterns in their analysis. These patterns often involve multiple candlesticks and are more complex to interpret. However, with practice and experience, traders can better understand market trends and potential outcomes.
Some commonly used advanced candlestick patterns include engulfing patterns, hanging man, and dark cloud cover. Each pattern has unique characteristics and can provide valuable insights into market movements. By understanding these advanced patterns, traders can gain a competitive edge in their trading strategies.
How to interpret candlestick patterns and what they indicate about market sentiment
Candlestick patterns, a popular tool in technical analysis, can offer valuable insights into market sentiment and potential price movements. These patterns visually represent the trading activity and help traders identify possible entry and exit points.
For instance, a doji candlestick, characterised by its small body and equal opening and closing prices, suggests indecision in the market. It often occurs during periods of consolidation or when buyers and sellers are in equilibrium. On the other hand, a hammer or hanging man candlestick with a small body and long lower shadow indicates a potential trend reversal. These patterns can be powerful signals for traders to anticipate changes in market direction.
However, it is essential to note that more than relying solely on candlestick patterns may be required. To validate these patterns’ signals, traders should consider using other technical indicators and conducting fundamental analysis. Combining these tools can provide a more comprehensive understanding of market trends and enhance decision-making.
Using candlesticks in conjunction with other technical indicators for better analysis
While candlestick patterns can provide valuable information, they are often used with other technical indicators for a more comprehensive analysis. It is because no single indicator can always accurately predict market movements.
By combining candlestick patterns with other tools, such as trend lines, moving averages, and oscillators, traders can better understand market trends and make more informed trading decisions. It is essential to use a combination of indicators and not rely on just one to avoid potential false signals.


