

What is the Difference Between Data Visualisation and Storytelling with Data?
2 min read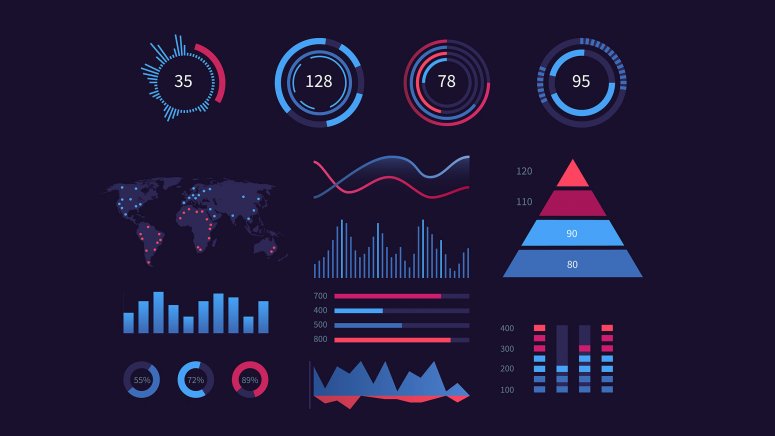
In the world of finance, data has become a very important source of information for decision-making. Data is indeed ready and accessible, and most companies have more than enough data to work on, but how to work with it efficiently and effectively is their greatest struggle. Data might be available, yes, but translating it into a workable form is the challenge, and while data remains raw, CFO’s and decision-makers won’t be able to interpret them.
There are two core concepts in data analysis: Data Visualisation and Storytelling with Data. They might be different but both have equally important roles to play. It is essential to understand the difference between the two and how to utilise them to become useful information.
DATA VISUALISATION
Data visualisation is basically the visual presentation of the data. It translates data into a more comprehensive approach through visual context by using graphs, maps, charts, or any other visual format, making it easier for any person to interpret and identify trends and outliers. Visualisation has a more powerful impact on your audience. It is proven to be more persuasive thereby amplifying your message to the audience which easily captures and unites everyone into a common goal. Humans are known to be more drawn to visuals, which is why a 30 second TV ad or a simple photo can immediately convey a message to the consumers more than written words can.
Data visualisation provides a clearer understanding on the operations of the business. Measured data from large amounts of information is being collated and presented into a simpler form, allowing key decision-makers to create quicker and more informed decisions for the company. It draws the attention of the audience to key insights, which eventually leads to action.
DATA STORYTELLING
Storytelling with Data is different to data visualisation. It is a process of narrating a set of data and its accompanying visualisations and conveying the meaning into a more simplified and comprehensive approach. It uses an auditory approach to communicate information gathered from analysing data. When data storytelling, you must be able to identify what you want your audience to know, and how to structure it in a way that will lead to action or arrive at a sound decision.
Unlike data visualisation, data storytelling is a bit more critical. Before you even begin, you must already have a roadmap of your data, filtering only what is necessary based on the analysed data. It is also important to keep the attention and interest of your audience on the story that you are telling so that everyone will come up with a united and concrete decision for the benefit of the company.
Combining data visualisation and data storytelling actually works all the time. When telling a story, visual aides are often used to convey a stronger message. Data visualisation storytelling helps to quickly identify and elevate key points for discussion and consideration, making it easier for decision-makers in the company to devise the best possible course of action.